If you’re thinking of advertising on idratherbewriting.com, it’s important to get a sense of the traffic and analytics of the audience so that your ad not only has visibility, but visibility with the right audience.
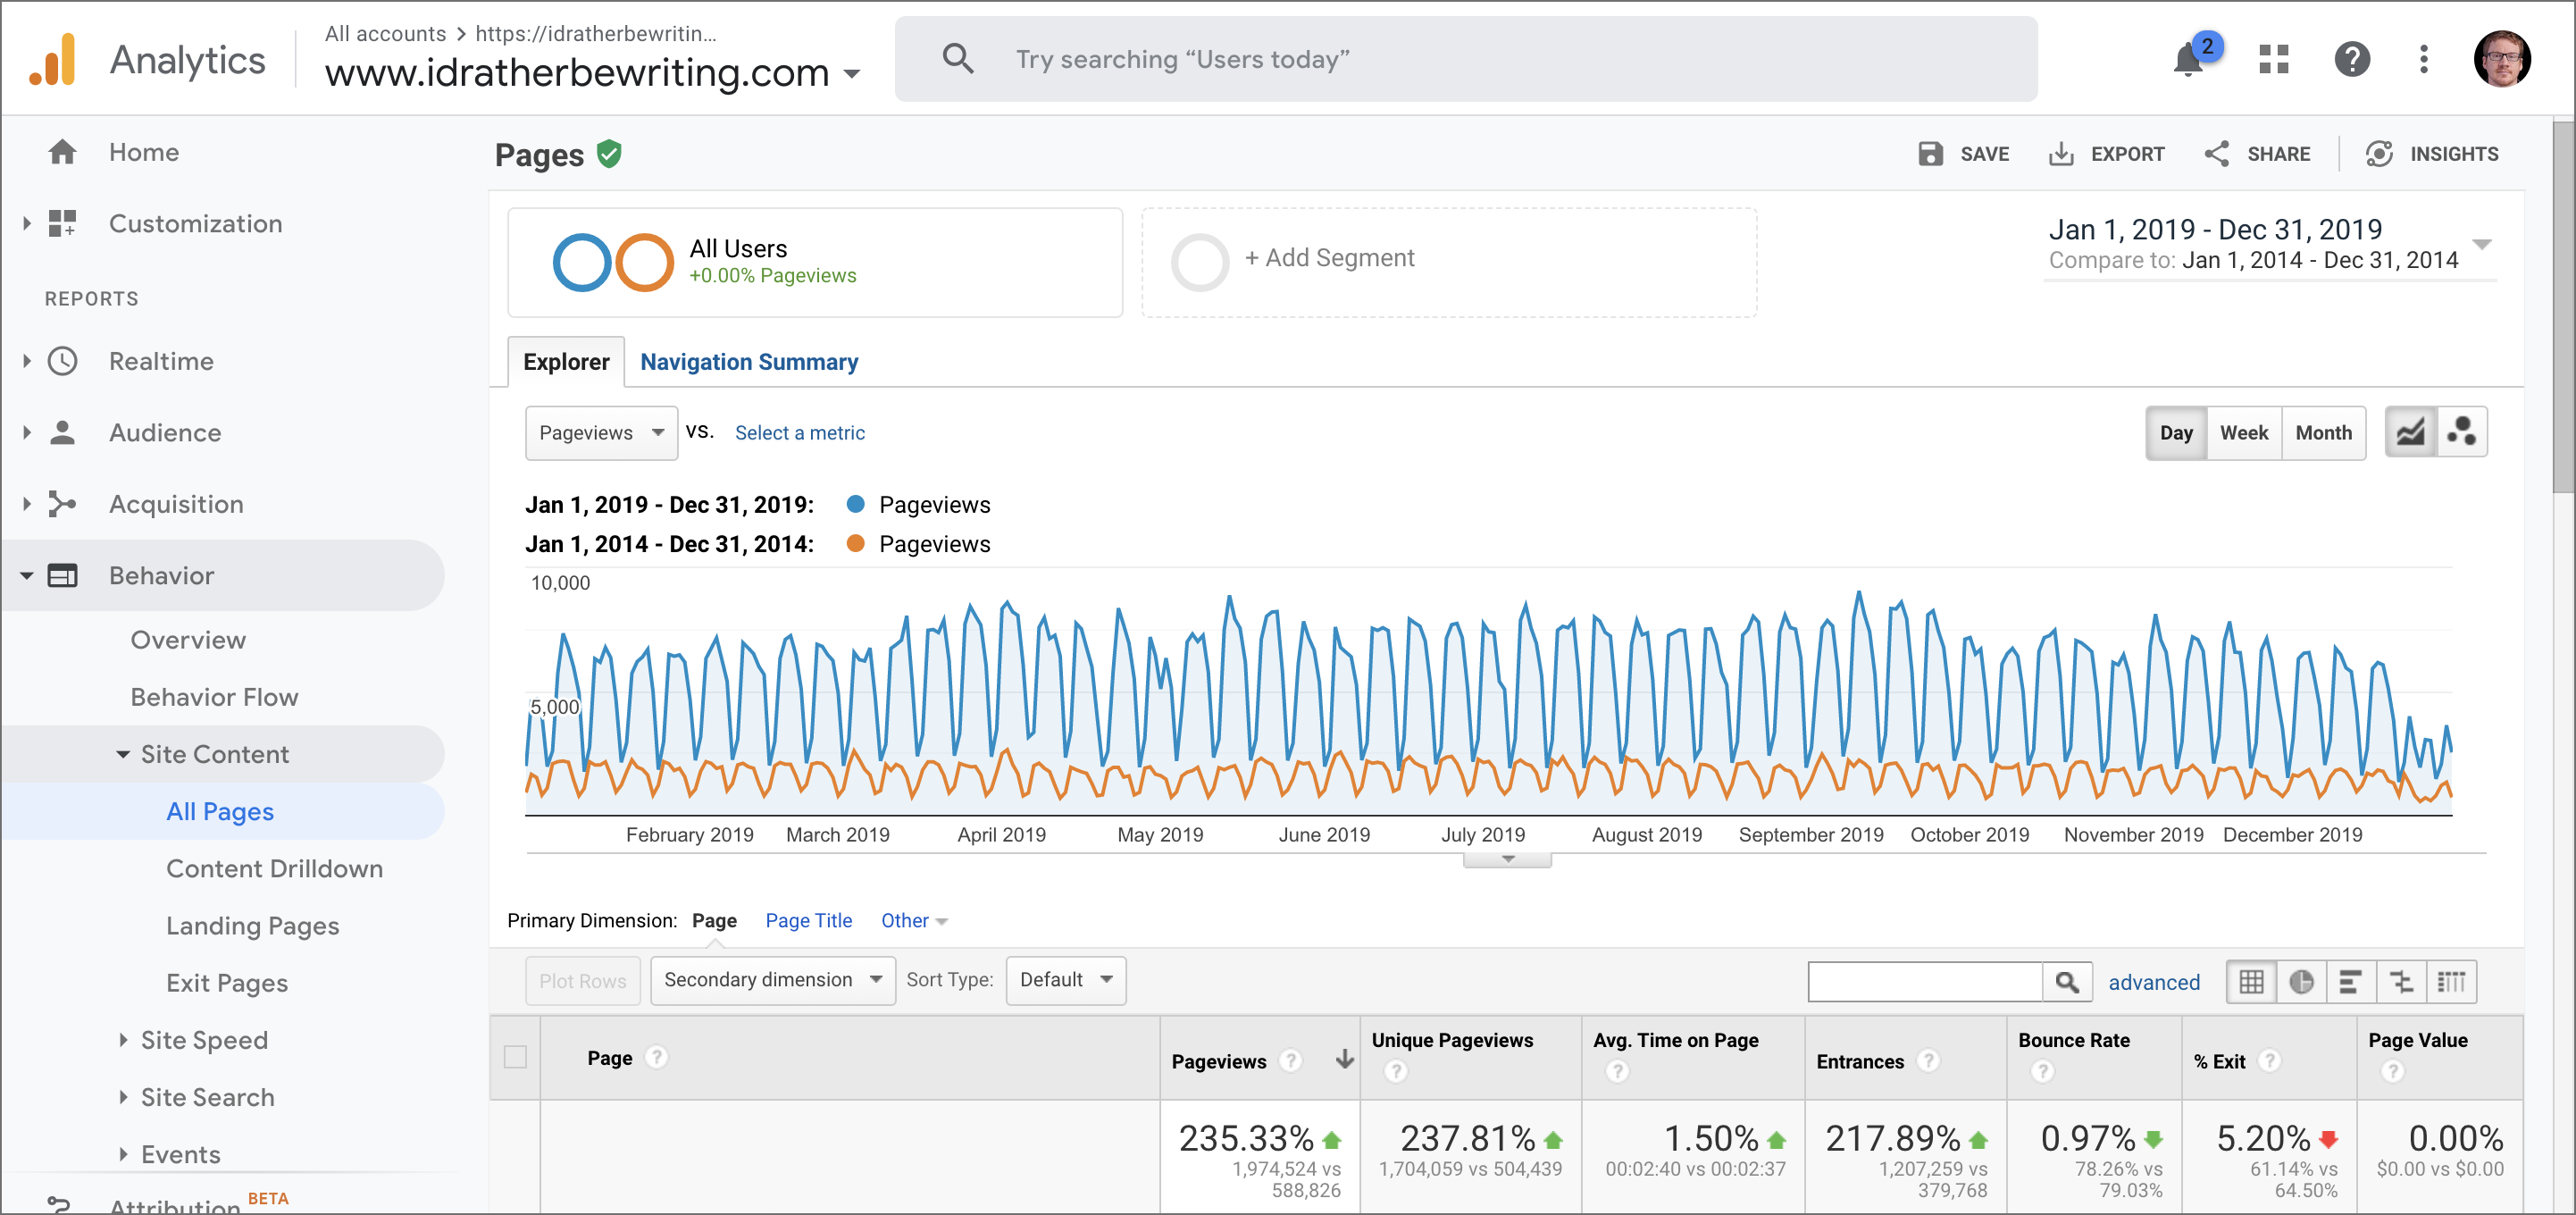
In 2019, idratherbewriting.com had 1,974,524 page views, or about 5,409 page views a day (225 page views an hour). More specifically, users created 1,207,264 sessions, with 1.64 pages per session and an average of 1:41 minutes per session.
Overall page views
Here’s a breakdown of site traffic analytics on idratherbewriting.com from Jan 1, 2019 through Dec 31, 2019, according to Google Analytics. The blue line represents 2019, while the brown line represents 2014 for comparison.

The above screenshot compares the traffic of the site in 2019 with the traffic 5 years earlier. In 2014, the total page view count for the year was 588,826. The site’s traffic has grown by 335% over 5 years.
Analytics breakdown
The following table includes more details from other Google Analytics reports. To make the data more meaningful, I’ve provided both the 2018 and 2019 data so you can compare the changes from one year to the next. I also round data to the nearest whole number (e.g., 1.51% is rounded to 2%; 1.49% is rounded to 1%).
| Jan 1, 2018 - Dec 31, 2019 –> Jan 1, 2019 - Dec 31, 2019 |
Count |
|---|---|
| Page views | 1,552,615–>1,974,524 |
| Average page views per day | 4,253–>5,409 |
| Average page views per hour | 177–>225 |
| Unique page views | 1,331,869–>1,704,059 |
| Average time on page | 2:40–>2:40 |
| Users | 687,818–>909,236 |
| Sessions | 942,306–>1,207,264 |
| Sessions per user | 1.37–>1.33 |
| Average session duration | 1:44–>1:41 |
| Pages per session | 1.65–>1.64 |
| Bounce rate | 78%–>78% |
| Organic search traffic (unpaid search traffic) | 495,033–>761,144 |
| Traffic from social | 5,596–>6,373 |
| Social site breakdown | Linkedin 49%–>42%, Facebook 20%–>15%, Twitter 17%–>23% |
| Geographical region | US 35%–>32%, India 16% –>17%, UK 5%–>5% |
| Browser | Chrome 73%–>76%, Firefox 9%–>9% |
| Device category | desktop 86%–>88%, mobile 12%–>11%, tablet 2%–>1% |
| Device type | iPhone 37%–>38%, iPad 7%–>6%, Google Pixel 1%–>1% |
| Operating System | Windows 60% –>59%, Mac 20%–>21%, Android/iOS 13%–>12% |
| Age | 18-24 (18%–>15%), 25-34 (48%–>52%), 35-44 (23%–>22%), 45-54 (8%–>7%), 55-64 (3%–>2%) |
| Gender | male (72%–>73%), female (28%–>27%) |
All of this information is provided through Google Analytics by default. (I don’t have any special scripts or other tracking cookies other than what Google adds through Google Analytics. Also note that I’m not sure how Google tracks age and gender. Google also tracks hobby categories, though I haven’t shown it here.)
API doc traffic percentage
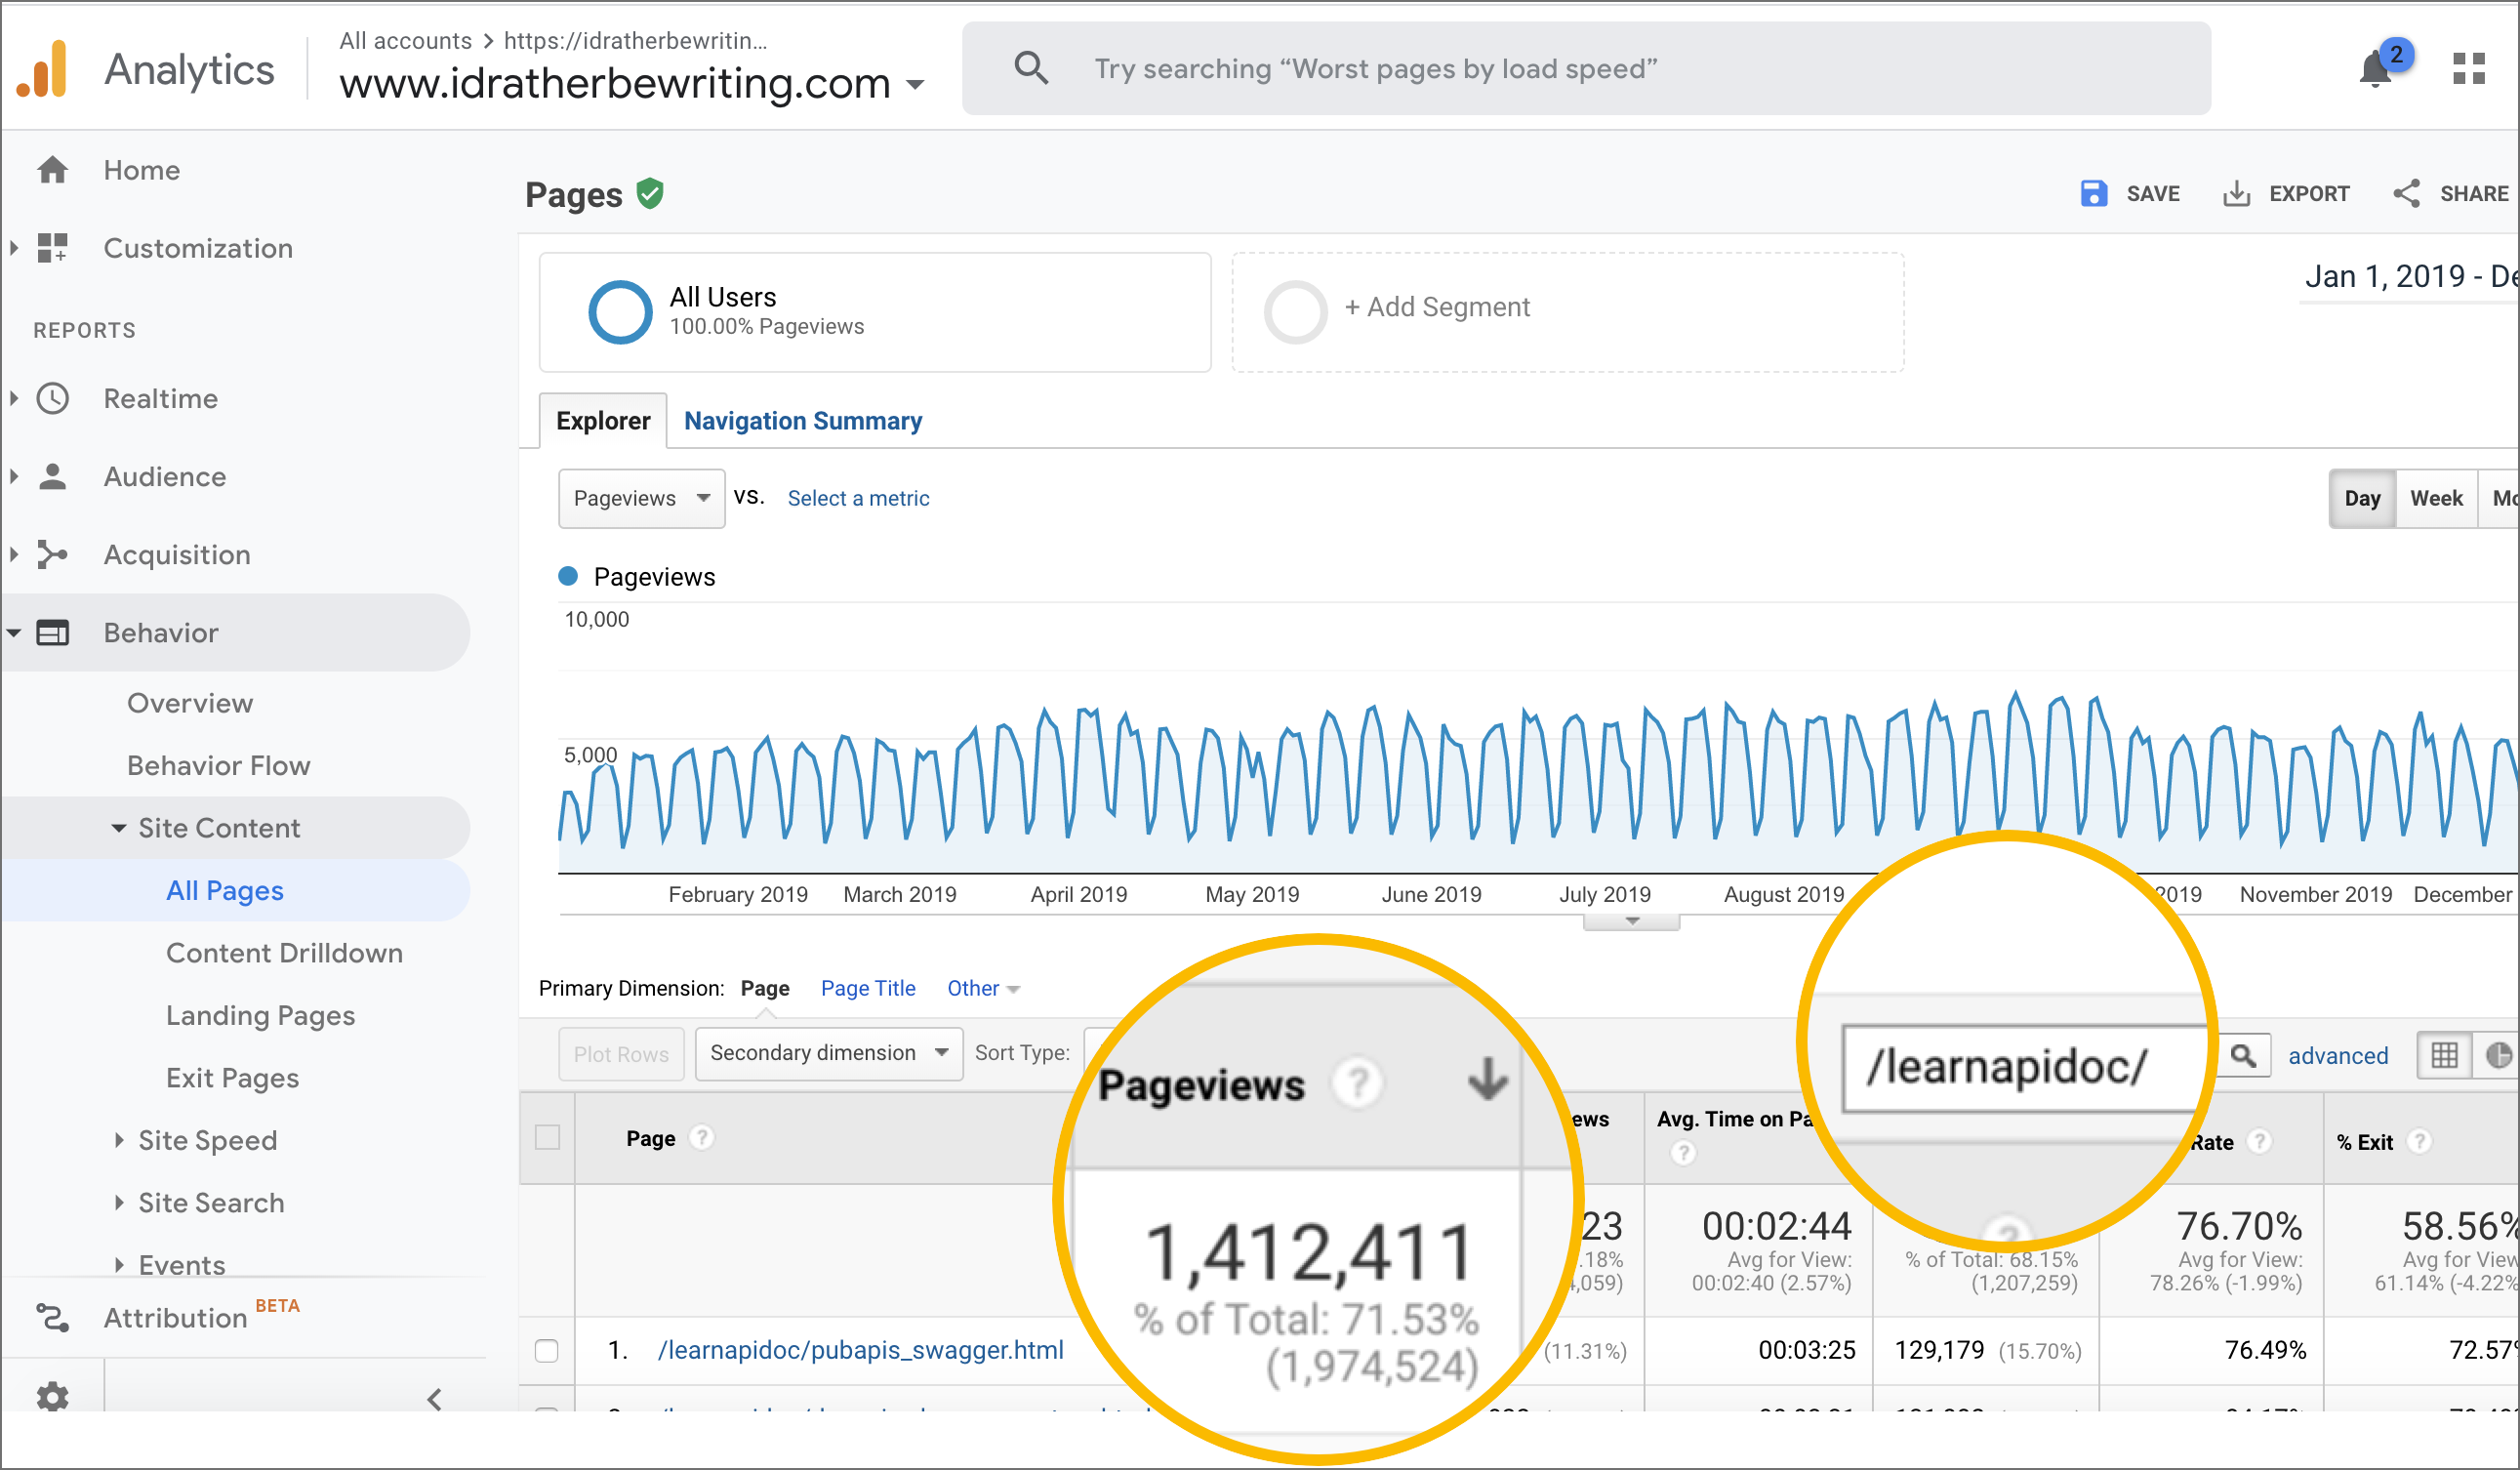
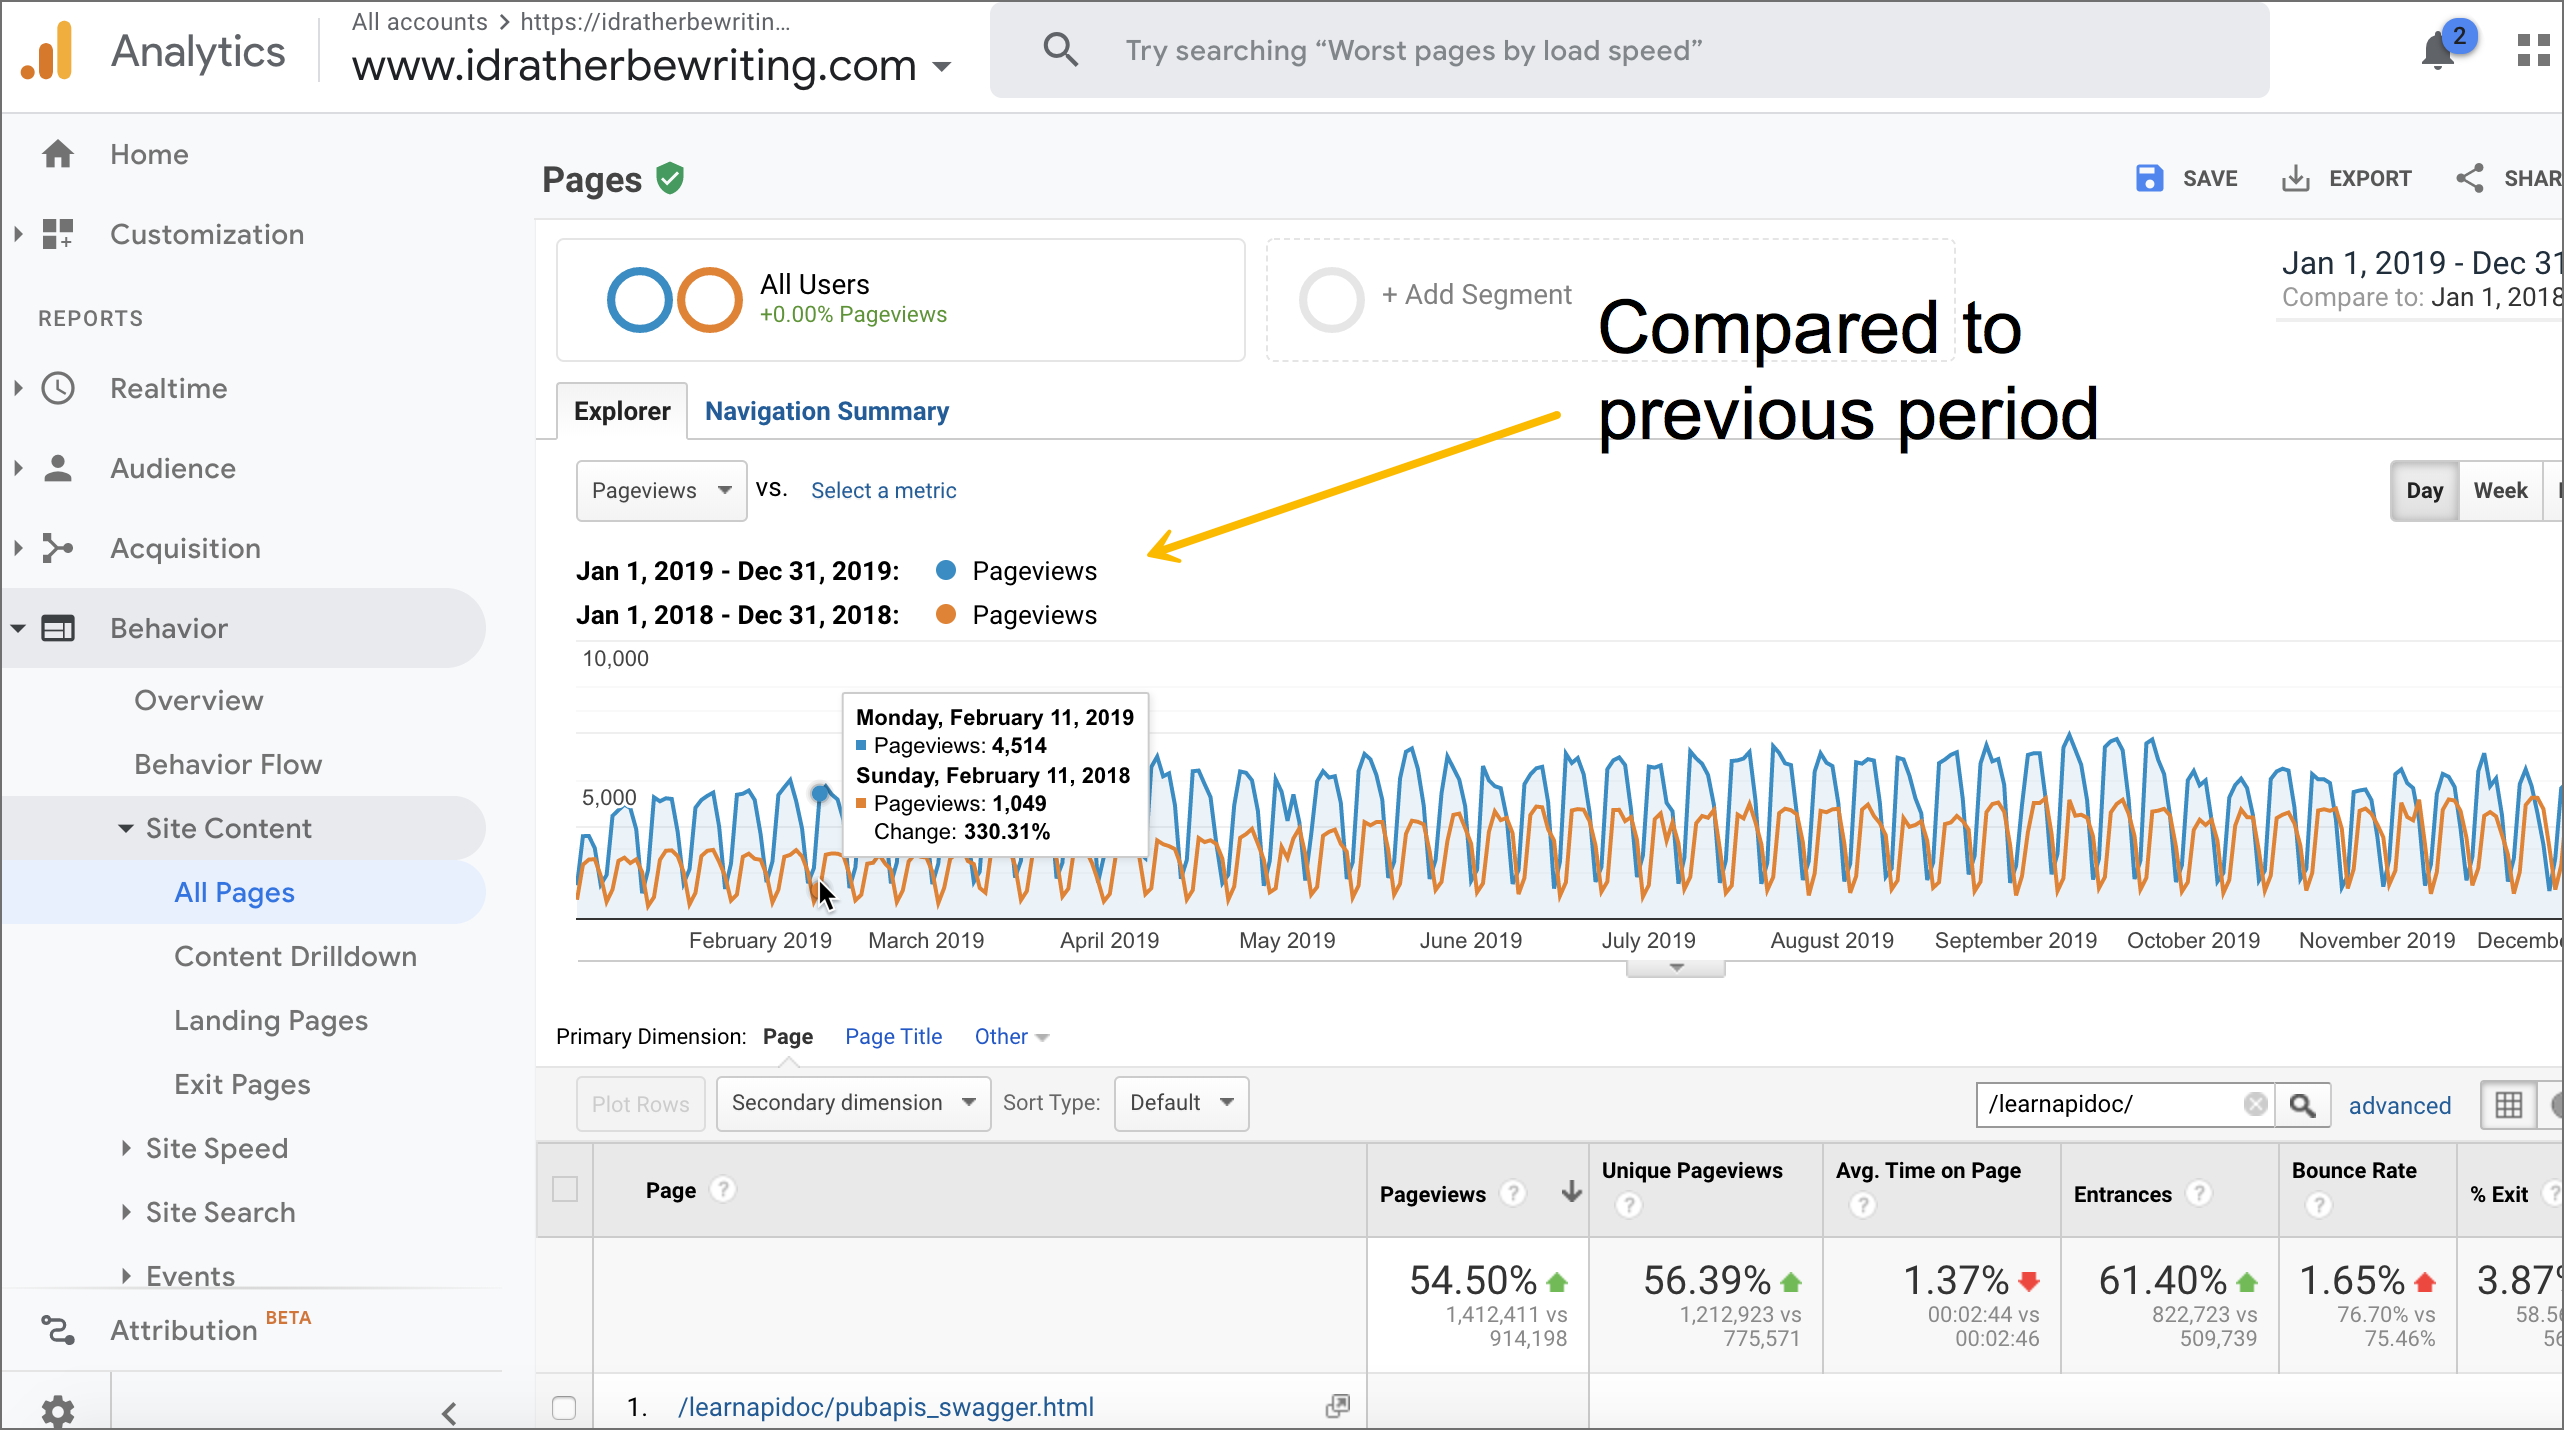
In 2018, 59% of my site traffic came to my API documentation site (/learnapidoc/. In 2019, that percentage jumped up to 72%

Here’s a graph that compares this growth to the previous period:

The traffic from the API documentation visitors is outperforming other traffic sources. My most popular page is Swagger UI tutorial (8.24% of total traffic), followed by Parameters (8.18%), OpenAPI tutorial (2.41%), Postman (2.27%), and Access and print JSON (2.05%). The remaining pages are all under 2% of total traffic.
Quality of impressions
The quality of impressions depends on the influence of the site. Impressions from a highly influential site carry more weight than impressions from a less influential site. In earlier years, several companies ranked the most influential bloggers in tech comm. Their categories shifted more broadly and eventually people stopped creating these influencer lists. Links to previous rankings are below.
- Top 25 Content Experience Influencer 2017
- Top 25 Content Strategist Influencer 2016
- Most Valuable Professional #2014, Indigo Byte Systems.
- #3 Influencer in #techcomm in 2014
- #1 Influencer in #techcomm 2013
- #1 Influencer in #techcomm 2012
- Most innovative tech comm blogger of 2011
- #2 Influencer in #techcomm 2010
If you look at my Presentations, you can see that I’ve also given more than 100 presentations during the past decade.
Posts analyzing site analytics
For more details about analytics, see the following posts. These posts expand on audience interests and demographics.
- 2019 — Reflections on my 2019 site analytics
- 2018 — Site analytics from Jan 1 to Dec 31, 2018 – are more engineers writing docs now?
- 2017 — Unexpected realizations after a comprehensive review of my 2017 site metrics
- 2016 — Analyzing top posts on my blog during 2015 — Deciding between brand versus readership
- 2015 — Top 10 posts, podcasts, tweets of 2014 – and what it all means


