Site analytics from Jan 1 to Dec 31, 2018 -- are more engineers writing docs now?
Listen here:
You can download the MP3 file, subscribe in iTunes, or listen with Stitcher.
Site analytics for Jan 1 to Dec 31, 2018
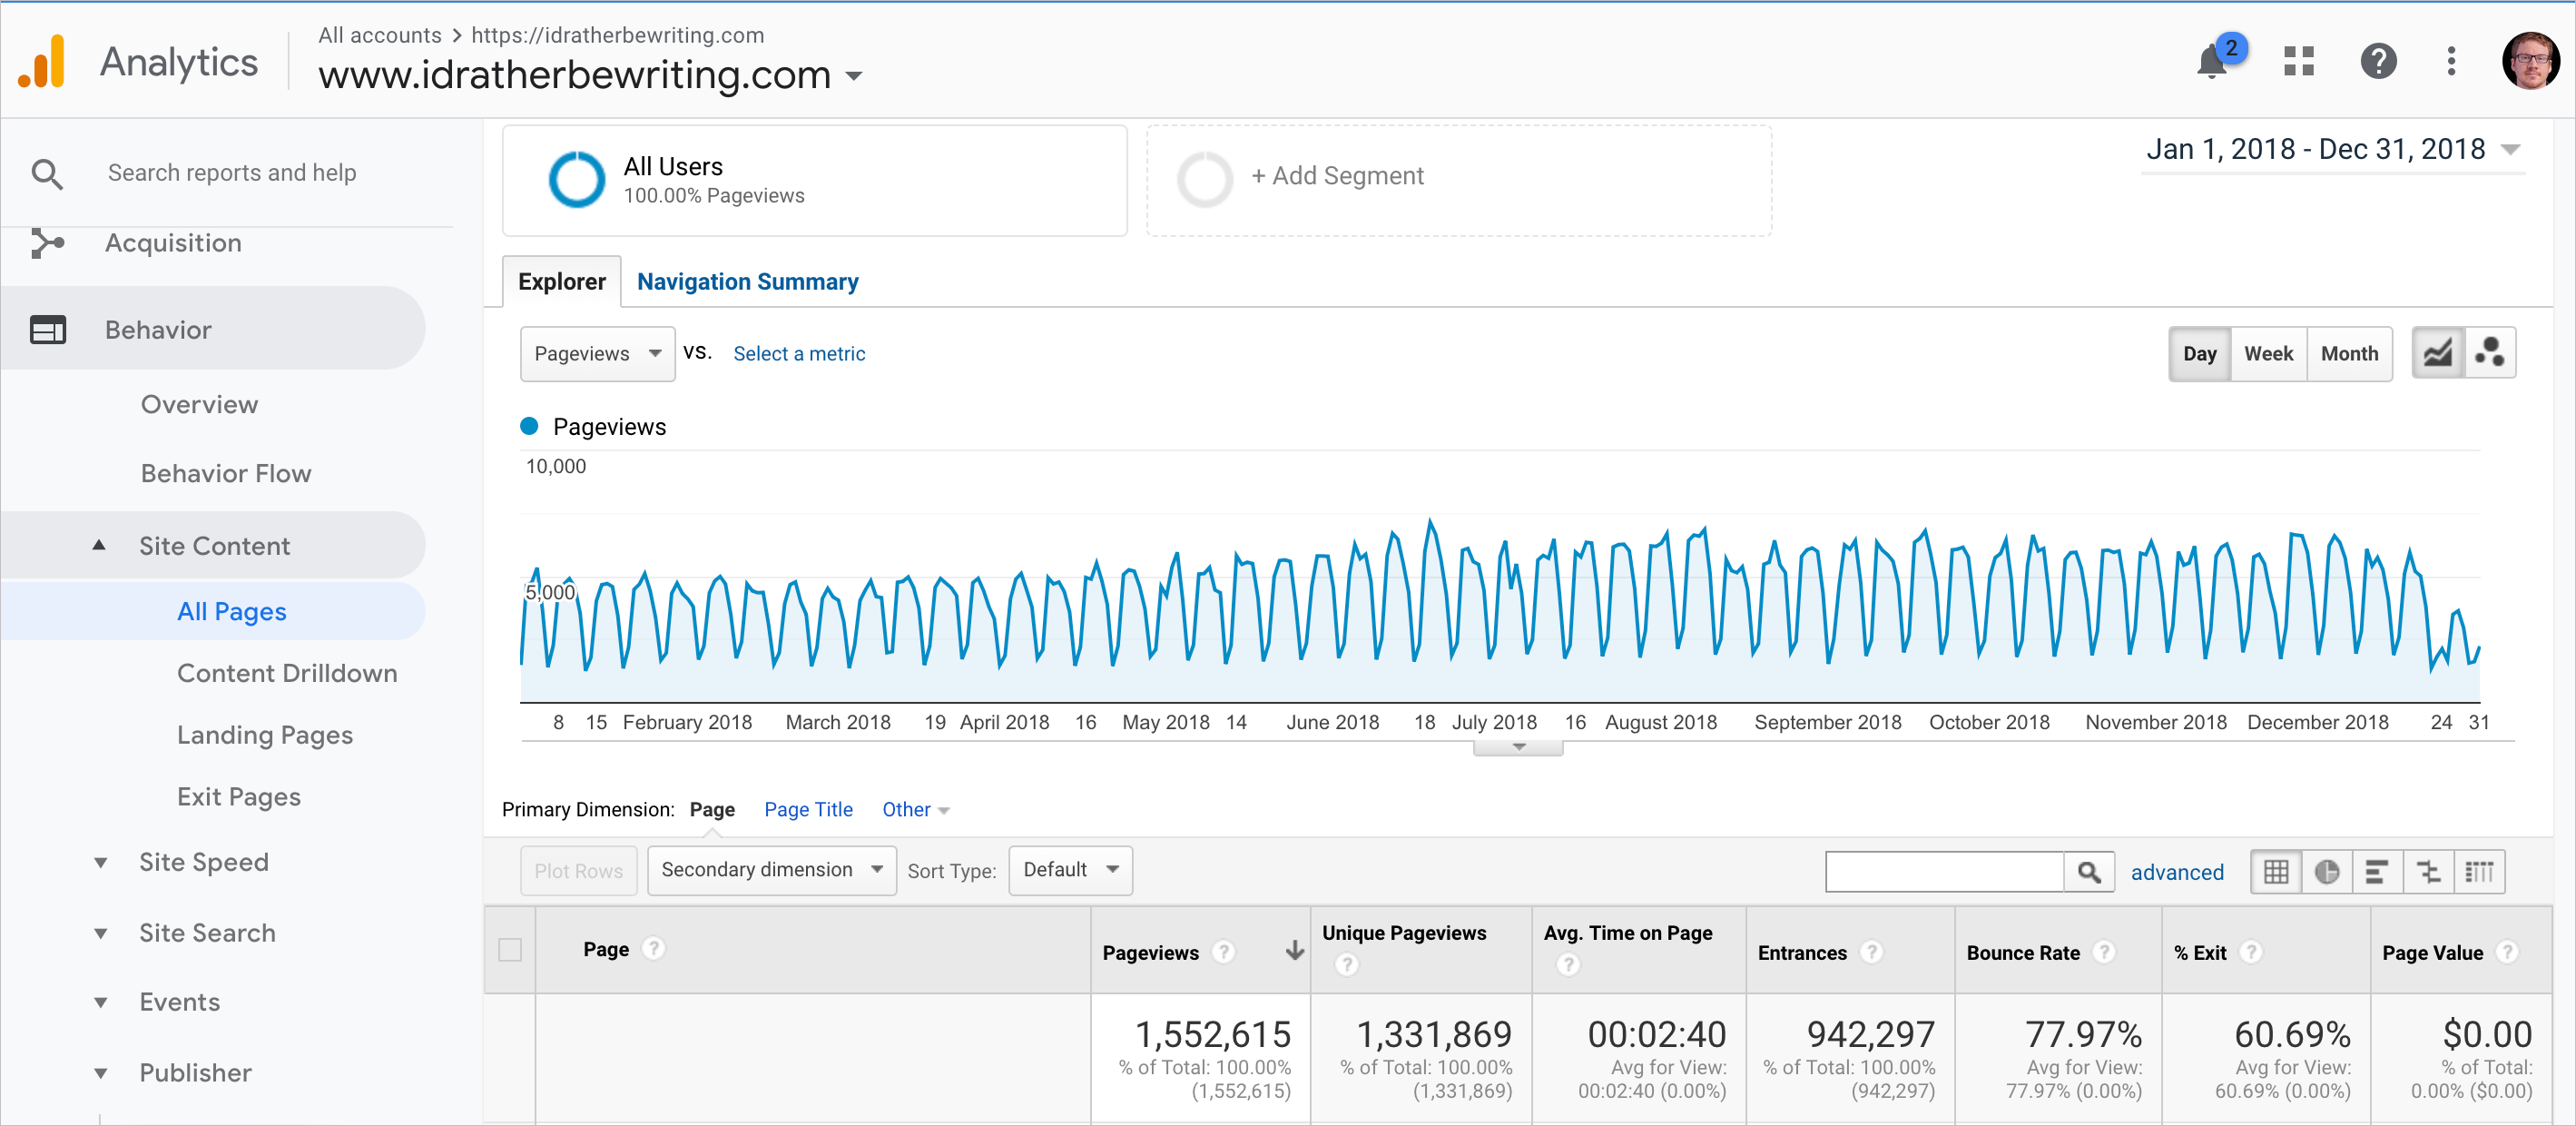
Here’s a breakdown of site traffic analytics on idratherbewriting.com from Jan 1, 2018, through Dec 31, 2018 (based on Google Analytics):
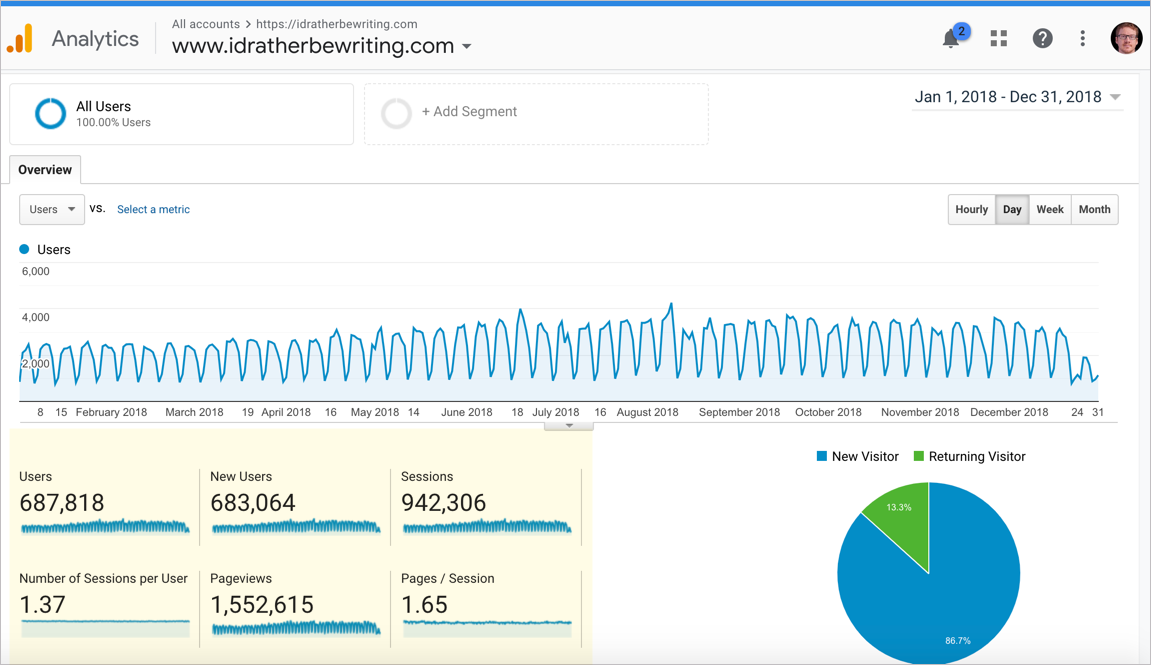
Here’s another slice of analytics focusing more on audience:
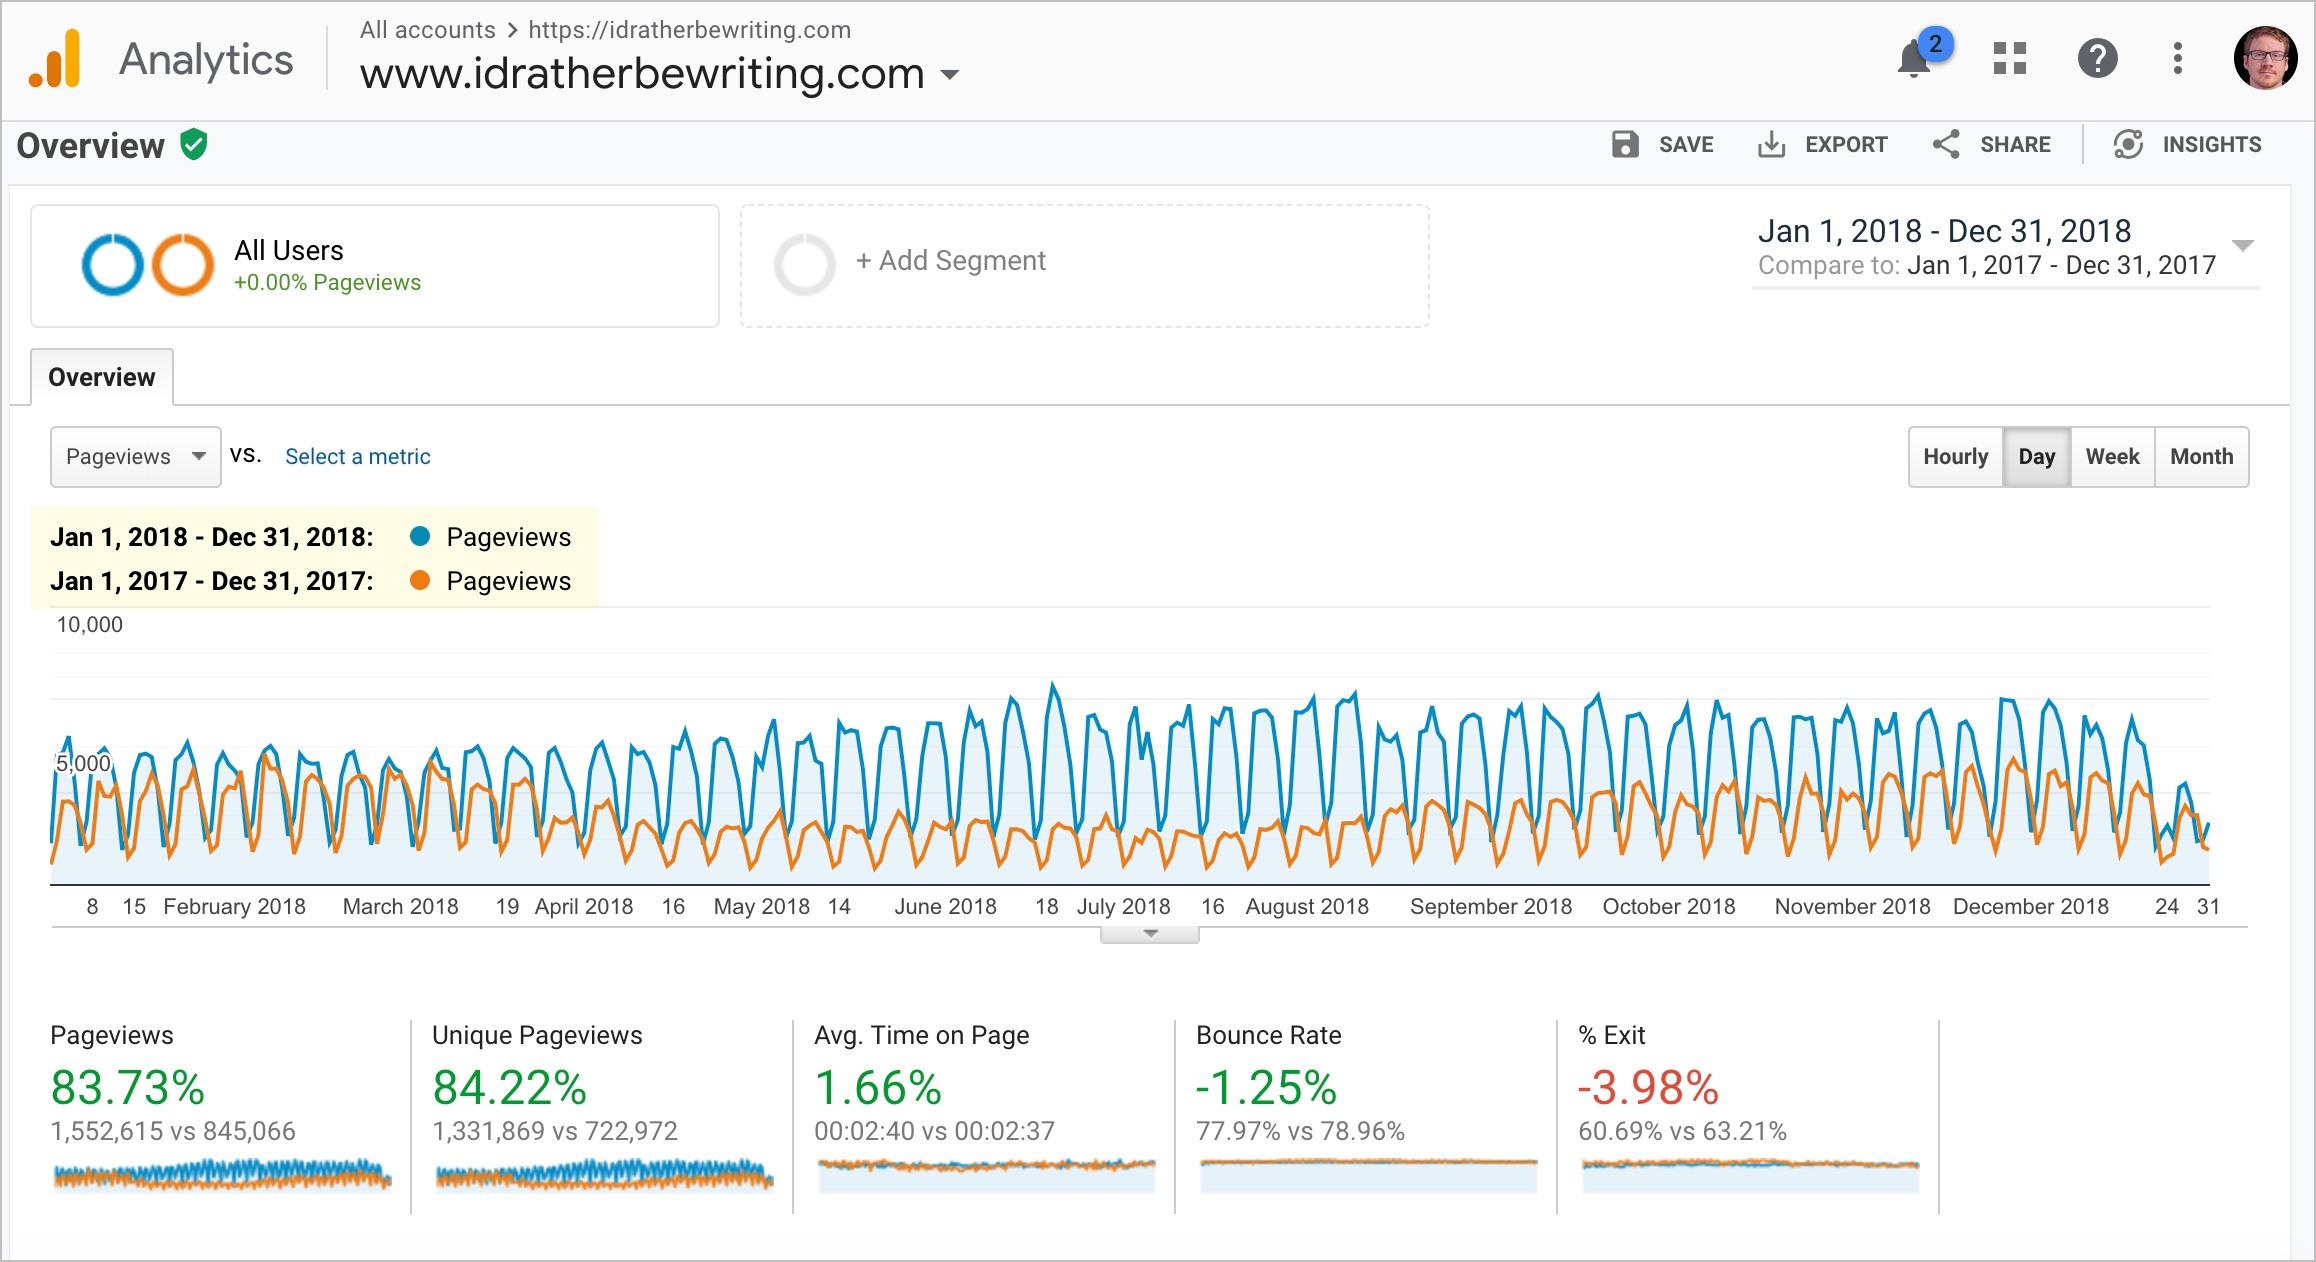
I’d Rather Be Writing received significantly more traffic in 2018 (nearly double the page views) than the previous year. The blue line represents 2018, while the brown line represents 2017.
The following table includes more details from other Google Analytics reports (the date range is Jan 1, 2018, to Dec 31, 2018):
| Jan 1, 2018 — Dec 31, 2018 | Number |
|---|---|
| Page views | 1,552,615 |
| Average page views per day | 4,253 |
| Average page views per hour | 177 |
| Unique page views | 1,331,869 |
| Average time on page | 2:40 |
| Users | 687,818 |
| Sessions | 942,306 |
| Sessions per user | 1.37 |
| Average session duration | 1:44 |
| Pages per session | 1.65 |
| Bounce rate | 78% |
| Organic search traffic | 495,033 |
| Traffic from social | 5,596 |
| Social site breakdown | Linkedin 49%, Facebook 20%, Twitter 17% |
| Geographical region | US 35%, India 16%, UK 5% |
| Browser | Chrome 73%, Firefox 9% |
| Operating System | Windows 60%, Mac 20%, Android/iOS 13% |
| Device type | Desktop 86%, mobile 12%, tablet 2% |
API doc traffic percentage
Here’s the big revelation. About 59% of the overall traffic to my site comes from my API documentation site:
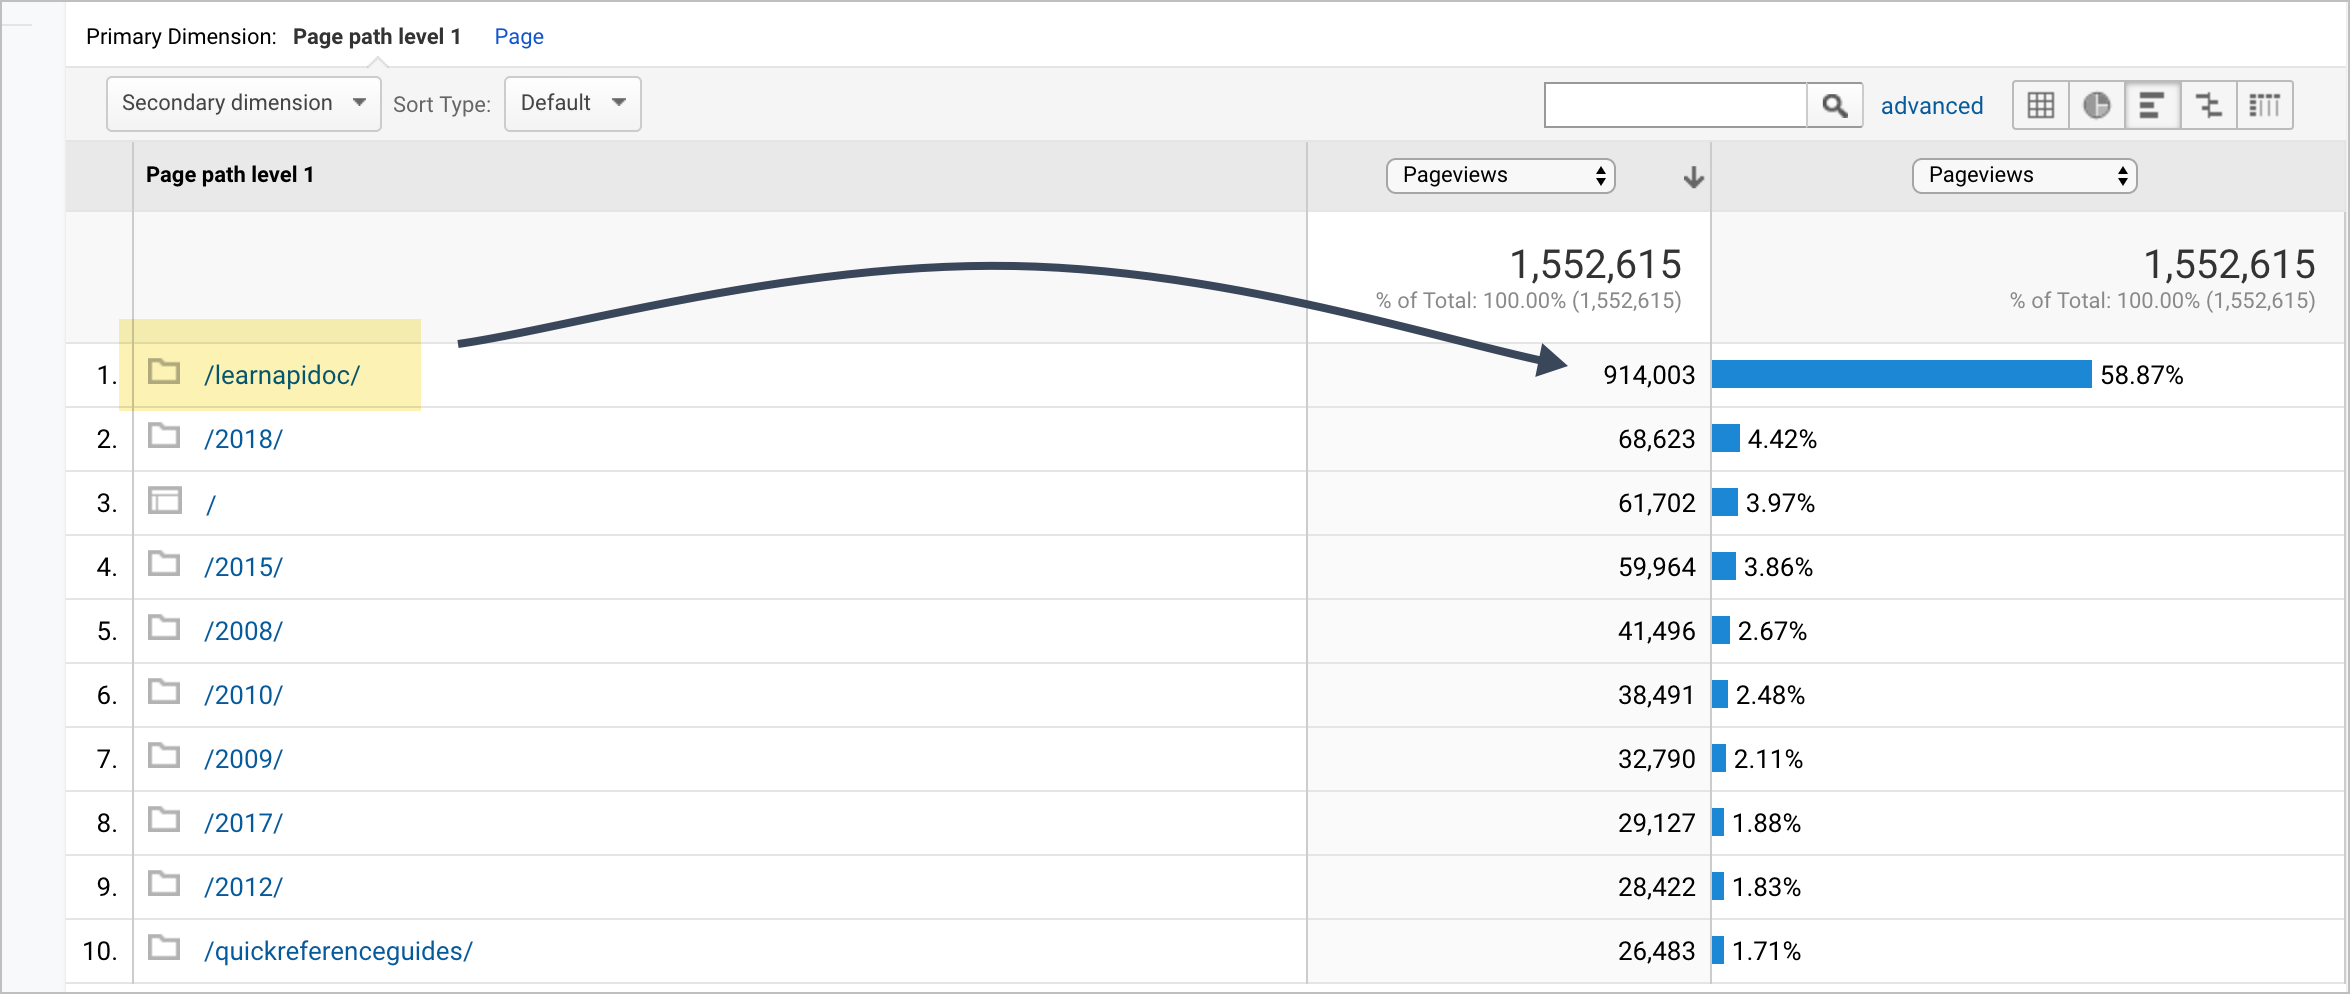
The 83 posts I wrote during 2018 only accounted for 4.42% of my site’s traffic. The traffic from the API documentation visitors is outperforming other traffic sources.
Age and gender
The breakdown of audience age and gender is as follows:
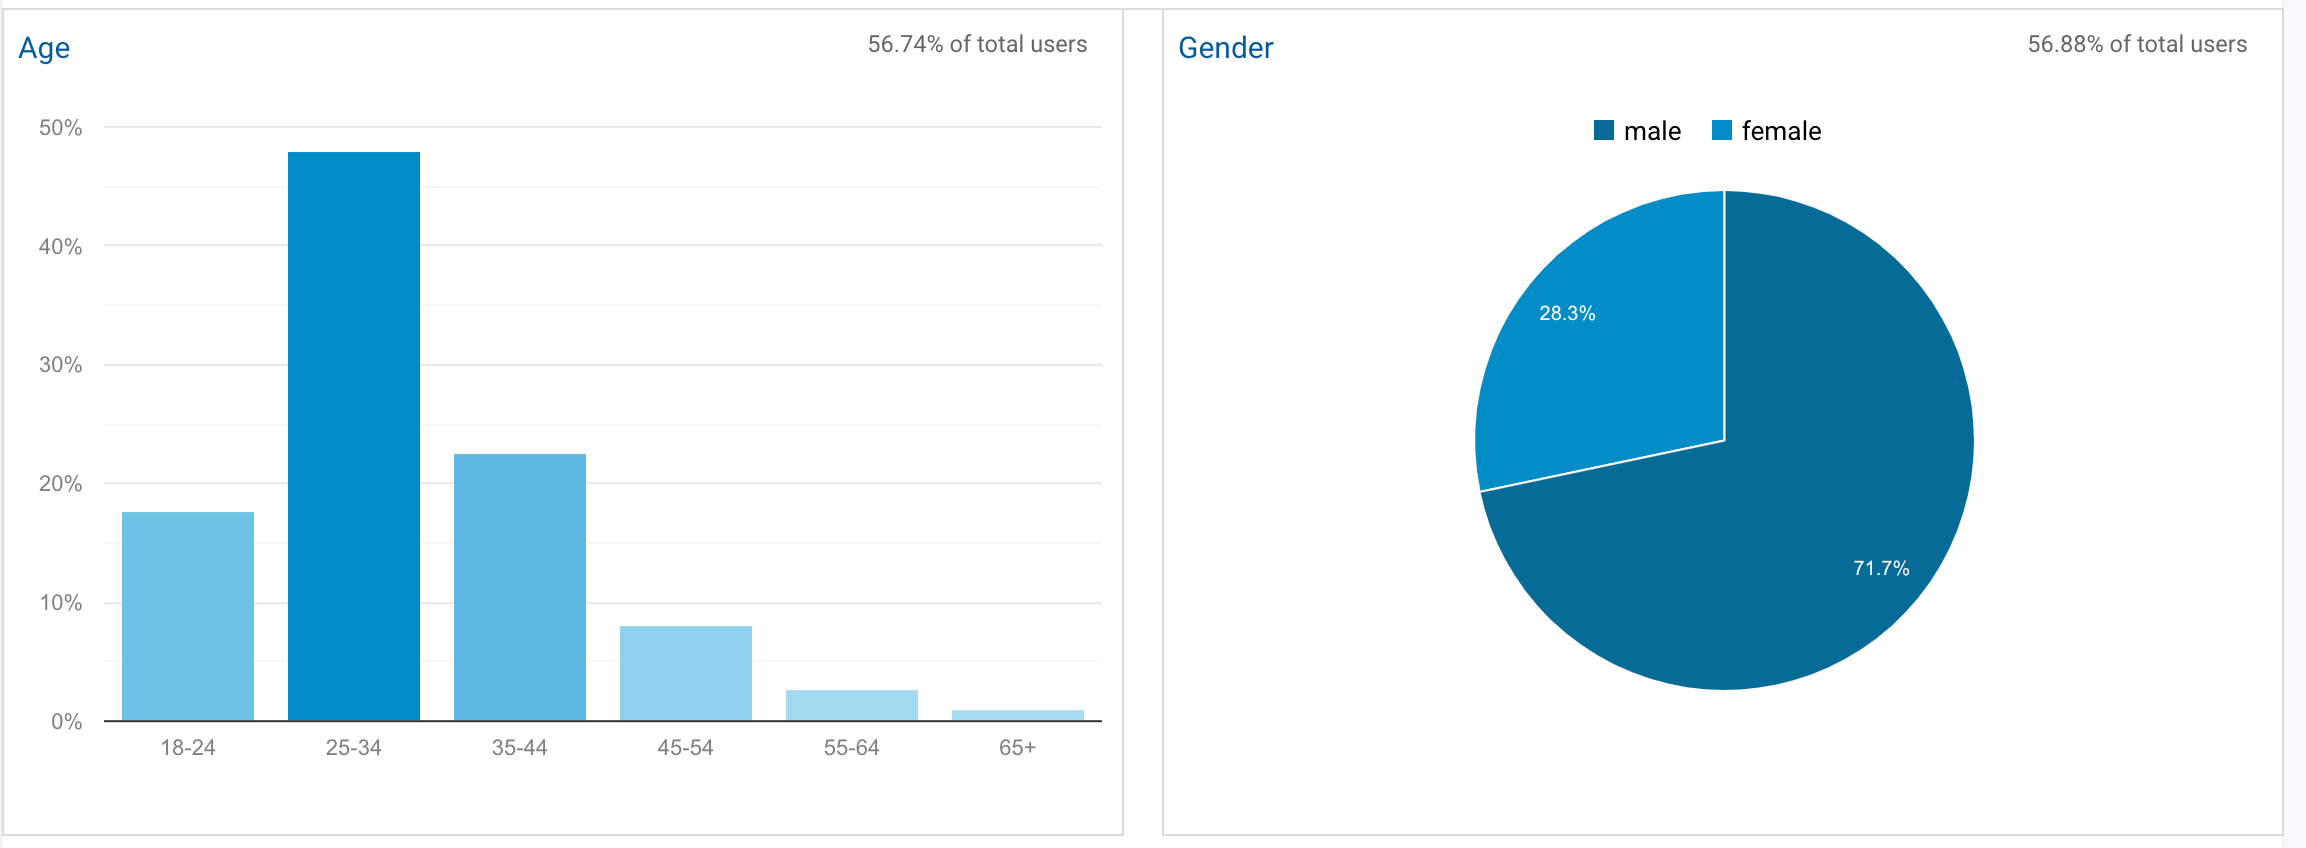
In years past, the gender distribution was more balanced. But with more traffic coming in through my API documentation site, it suggests more programmers are reading the content. Why? The 2018 GitHub survey found that the gender breakdown among engineers was 92.9% male, 6.9% female. Given that my overall gender breakdown is now 71.7% male, 28.3% female, I think many of those readers are engineers rather than technical writers. In years past (such as 2017), the gender breakdown on my site was more evenly balanced. In fact, just last year, Google Analytics indicated that 34% of readers were male, 66% female.
Top 10 lists for 2018
Here are a list of top 10 pages, sliced in different ways.
Top 10 pages overall (across all sites)
Here are the top 10 overall pages that received the most traffic last year. (The pages weren’t necessarily written during 2018.)
- Swagger UI tutorial (12% of traffic)
- Documenting APIs: A guide for technical writers (5%)
- Step 3: Parameters (API reference tutorial) (4%)
- I’d Rather Be Writing: Latest posts (4%)
- Submit requests through Postman (3%)
- Quick Reference Guide Templates (2%)
- 10 realizations as I was creating my Swagger spec and Swagger UI (1%)
- OpenAPI 3.0 tutorial overview (1%)
- JavaScript: Events and Listeners (1%)
- Inspect the JSON from the response payload (1%)
Again, these top pages show that most of the traffic is coming through my API documentation site, with Swagger UI tutorial leading the way.
Top 10 blog posts in 2018
From the 83 posts I wrote in 2018, these posts received the most page views:
- What technical writing trends will we see in 2018? (9,765 views)
- If writing is no longer a marketable skill, what is? (3,703 views)
- Tech comm trends – why tech writers will be collaborating more with engineers (2,295 views)
- Do you have to relocate to an urban tech hub to find a technical writing job? (2,210 views)
- 10 ways technical writing is just like the World Cup (2,040 views)
- How to avoid being a secretary for engineers (1,893 views)
- The math game my daughter and her friend created with Codesters (1,599 views)
- Thoughts on docs-as-code after 3 years – it works! (1,455 views)
- Combatting the “Make-It-Pretty” Philosophy: Technical Writers Fight Back (Guest post by Emily January Petersen) (1,444 views)
- Tech comm trends: Providing value as a generalist in a sea of specialists (Part I) (1,416 views)
The most popular posts focused on the theme of trends and tech comm value.
Top 10 podcasts in 2018
Here are the top 10 podcasts in 2018:
- Recording of API documentation workshop in Denver (8,357 downloads)
- If writing is no longer a marketable skill, what is?(1,901 downloads)
- Preferring technical acuity over specialized knowledge (1,800 downloads)
- Reducing the complexity of technical language (new article in Simplifying Complexity series) (1,641 downloads)
- Articulating stories that influence product adoption (new article in Simplifying Complexity series (1,278 downloads)
- Recording of OpenAPI and Swagger presentation (for STC and WTD San Diego) (1,116 downloads)
- Evaluating the user experience of documentation — Podcast with Bob Watson (1,112 downloads)
- Upcoming full-day API documentation workshop in Menlo Park (1,022 downloads)
- My conflicted thoughts about the decentralized web (while taking the Census of Technical Communicators survey) (900 downloads)
- New post in Simplifying Complexity series – Principle 11: Be both a generalist and specialist at the same time (679 downloads)
I use Podtrac to track downloads. I’ve never seen a single podcast get as many downloads as the Recording of API documentation workshop in Denver, with 8,357 downloads. Across all podcasts ever published on my site, there were about 42,000 downloads in 2018.
Top 10 pages on API doc site
These were the top 10 pages on my API documentation site during 2018:
- Swagger UI tutorial (184,574 views)
- Documenting APIs: A guide for technical writers and engineers (70,162 views)
- Step 3: Parameters (API reference tutorial) (68,750 views)
- Submit requests through Postman (46,6350 views)
- OpenAPI 3.0 tutorial overview (20,455 views)
- OpenAPI 3.0 tutorial overview (18,970 views)
- Inspect the JSON from the response payload (18,909 views)
- Introduction to the OpenAPI specification and Swagger (18,040 views)
- Step 1: Resource description (API reference tutorial) (16,427 views)
- Overview of REST API specification formats (15,923 views)
Most of the traffic focuses on Swagger and the OpenAPI — in other words, reference documentation.
Reflection and analysis
Based on these analytics, what conclusions can we draw? Since most traffic (at least 59%) is coming into the API documentation site, it seems logical that I should continue to work on and develop the content there. Just because the content isn’t in the form of blog posts, it doesn’t mean traffic is any less. I worked a ton on the page content there during 2018 — incremental updates, refinements, re-organizations, screenshots, activities, slides, and more. I spent as much time working on the API content as on my regular blog.
In contrast, only 4.42% of traffic to my site comes in through blog posts written in 2018. 1.28% of the traffic comes in through my Simplifying Complexity site. (The rest of the traffic comes in through older blog posts or other pages.)
Overall, the increased traffic to my API documentation site grew my page views from 845,066 in 2017 to 1,552,615 in 2018, which is nearly double! This lopsidedness in traffic has given me a lot to think about.
That said, I think the engineering audience who comes to the API documentation site is less likely to comment, subscribe, and become regular readers. The bump in newsletter subscribers (about a thousand this year) doesn’t necessarily reflect the doubling of site traffic.
In 2018, I also posted video recordings of the two API workshops that I gave (in Denver and Menlo Park) this year. There were 4,691 views on YouTube for the collective videos, so these were also popular.
Some efforts that didn’t have much success this year include the Simplifying Complexity site and the Academic Practitioner collaboration project. Low traffic and page views for this content suggests that I should discontinue (or at least de-emphasize) these efforts. I probably won’t, though. I enjoy that kind of writing more.
Drawing conclusions
Let’s reflect on some ideas and predictions I wrote about in What technical writing trends will we see in 2018? (which I published at the beginning of the year). In that post, I said,
What will 2018 bring for the field of tech comm? Here’s what I think. In 2018, tech writers will play more cross-functional, interdisciplinary roles in order to establish value as generalists. … We all know that for the past few decades, technology has been getting more and more specialized. Knowledge is becoming more extensive, detailed, and deep. … Hyperspecialization has become only more acute with each passing year. Because of this specialization, I think more engineers and other specialists will be writing docs — because the information is so technical and specialized, tech writers will have a hard time developing the content. Instead, technical writers might play more general roles with content and more specialized roles in editing, publishing, and curating content.
In short, increasing specialization is driving engineers to write more documentation.
Looking at my metrics, I think there’s some truth to my observations. If a lot more engineers are searching for and consuming information on API documentation, it suggests that more engineers are writing documentation. This trend reinforces the idea that technical writers are playing more generalist roles while engineers handle the authoring of more specialized reference information.
If that weren’t the case, why would so many engineers be landing on my site? I mean, how else do you explain this:

I could be wrong about the demographic — maybe the traffic represents hoards of technical writers trying to transition into the API documentation space. That surely accounts for some percentage of the users, but given the drastic male gender imbalance in the metrics, it seems more likely that the bump in traffic consists of engineers. I’m planning to add a survey to the site to get a better sense of the user profile.
Another explanation might be that engineers previously looked to other sites for information. But after I added a site that explains approaches for reference API documentation, these same engineers have shifted their attention away from the other sites and over to mine. In this scenario, the number of engineers writing docs remains the same, but their location online has changed. I find this argument unlikely, but I’d need to do more research to make a definitive argument.
Here’s another interesting metric that supports my argument that more engineers are writing docs. The STC Salary Database says that only “180” technical writer jobs were added to the U.S. economy in 2017.
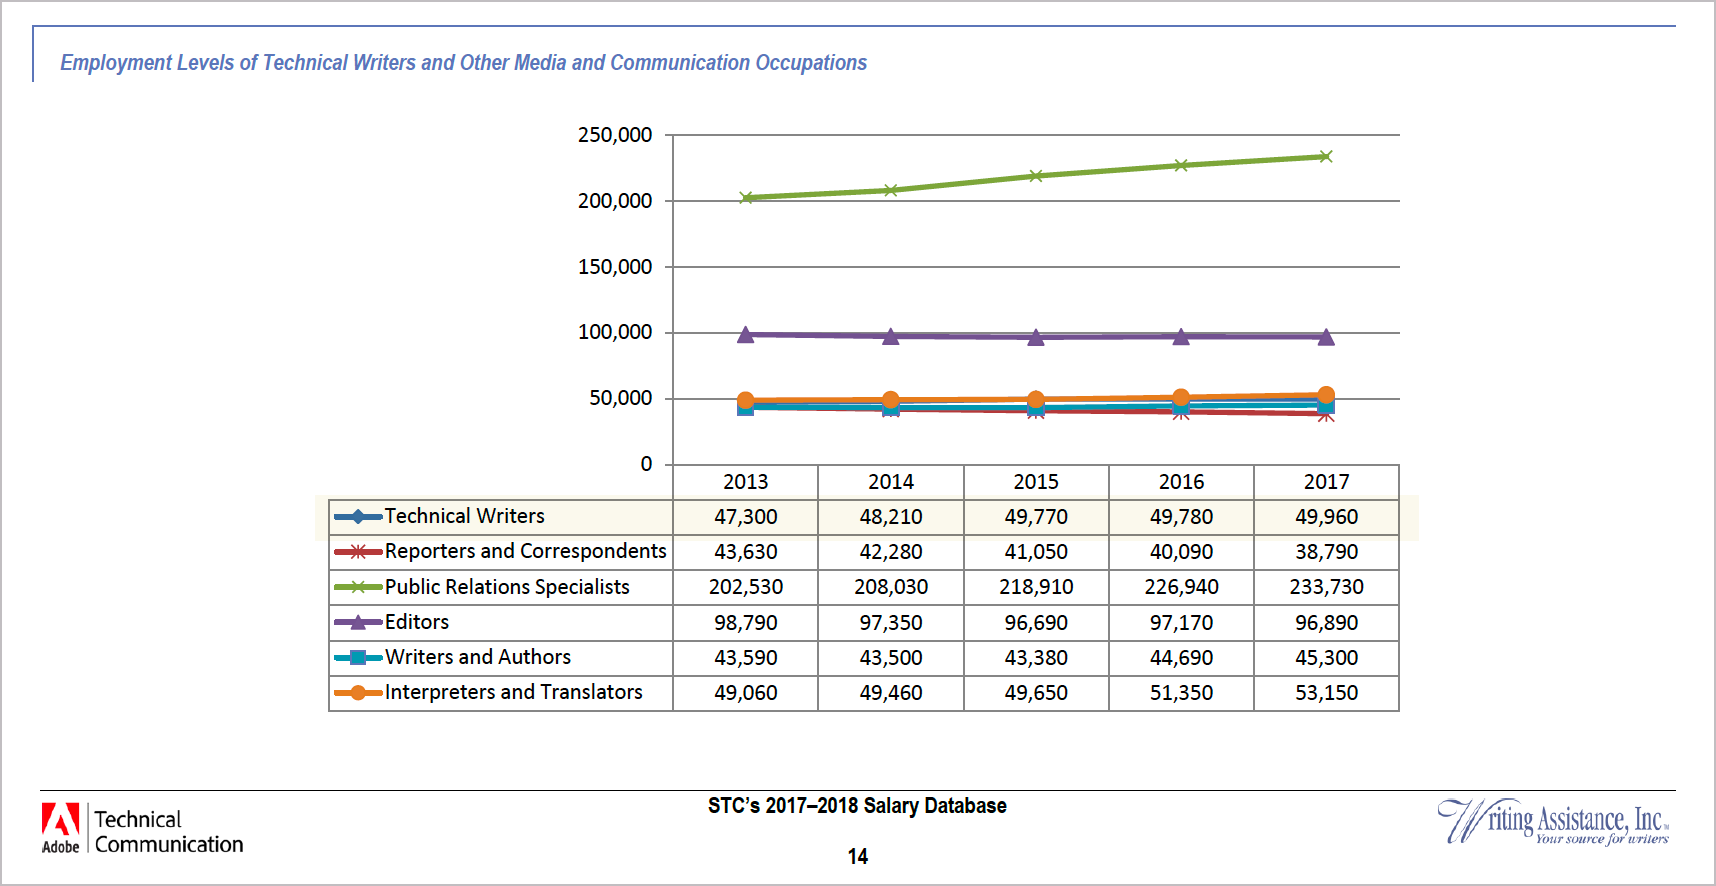
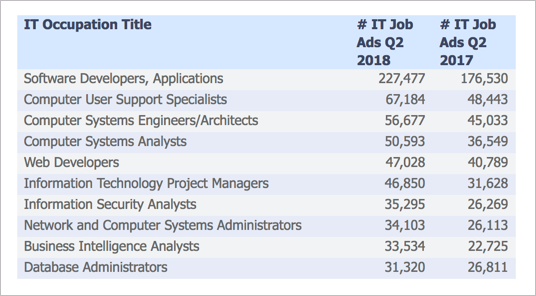
Yet I bet a lot more than 180 software engineering jobs were added during 2017. I don’t have a five-year history of engineering employment job growth (there are many different developer categories), but if you compare the IT jobs ads between Q2 2017 and Q2 2018 for “software developers,” you will find that, according to Association of Information Technology Professionals, “postings for software developers increased by more than 50,000” (“IT in Demand: Software developer job postings continue to increase”). Here’s their graphic that shows this growth:
Who is documenting all the code and other products that the additional 50,000 engineers are creating? The 180 new technical writers? Uh, I kind of doubt it. Engineers are likely playing more documentation roles.
As more evidence that engineers are writing, consider that docs-as-code tooling has flourished as a standard approach to writing and publishing documentation. Why would a software-engineering-based doc approach be flourishing, if not because more engineers are writing?
I wrote and focused on trends a lot this year. I argued that the increased amount of specialization means more engineers will be writing docs — because the content is so specialized, it exceeds the capacity of tech writers (typically generalists) to explain it. As a result, tech writers either need to step up their technical game, or they need to get more skilled at collaborating with engineers to elicit the needed information.
In some posts about trends, I explained the ramifications of the increase in specialization. I wrote:
However much I dislike the model where engineers develop content and technical writers add information usability, this just might be the norm in years to come. If the content is so specialized that only engineers can fully articulate it at the required level, then technical writers will play more supporting editorial roles, guiding engineers with content creation and making the information more readable/usable.
The degree to which engineers collaborate in the documentation process falls along a spectrum, for sure. But I don’t see how we can accommodate increasing amounts of specialization and complexity in the technology landscape without also incorporating more engineers into the writing process. (Embracing a more collaborative role in authoring specialized content)
In short, the increase in specialization is shifting the tech writer’s role to more of an editorial and publishing role, where tech writers collaborate more fully with engineers in the documentation process.
Let me conclude with a bit of reflection. In a recent review of my site by Craig Cardimon on Techwr-l, Craig wrote,
I’d Rather Be Writing remains a fantastic resource for new and seasoned technical writers. I admit I visited his site more when Johnson discussed more general technical writing topics regularly. He has migrated toward API programming documentation and producing podcasts, whereas I am still enjoying myself quite a bit as a software technical writer. Still, I bookmarked his site long ago, and visit it whenever I need a refresher or an introduction to topics around the career I love. (Review: Tom Johnson’s “I’d Rather Be Writing” Website)
Craig’s lament about my shift from software technical writing toward API programming documentation (a distinction that seems tenuous but still reflects a difference in domains) matches a bit of my own nostalgia and lamentation. For better or worse, we’re in another world now.
More reading
You can read my analysis of metrics for previews years here:
- 2017 — Unexpected realizations after a comprehensive review of my 2017 site metrics
- 2016 — Analyzing top posts on my blog during 2015 — Deciding between brand versus readership
- 2015 — Top 10 posts, podcasts, tweets of 2014 – and what it all means


